
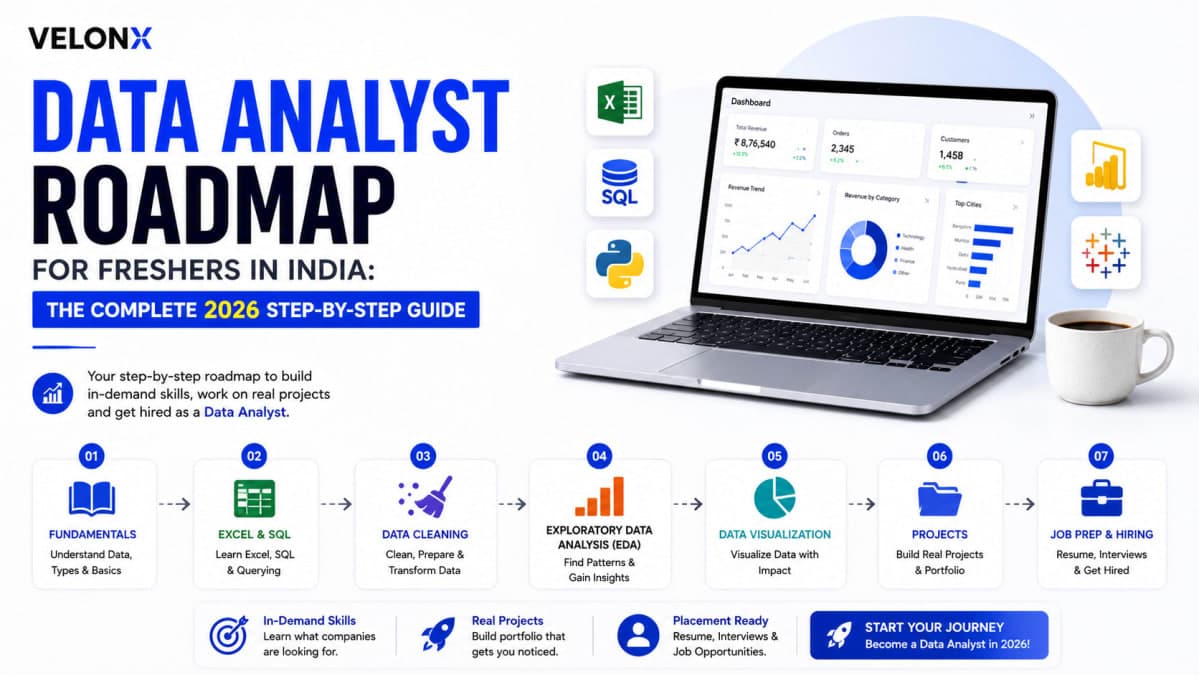
Did you download five different "data analyst roadmap" PDFs from LinkedIn and still not know where to actually start? Or maybe you finished a 3-month certification and still froze when an interviewer asked you a basic SQL question. Here's the truth: most roadmaps floating around online are just copy-pasted skill lists with no order, no timeline, and no idea what Indian recruiters actually test for.
A real data analyst roadmap for freshers in India isn't a list of tools — it's a sequence. Whether you're a final-year B.Tech/BCA student or a fresh graduate trying to break into analytics, this guide walks you through exactly what to learn, in what order, and how to prove it — from zero SQL knowledge to your first offer letter.
What Does a Data Analyst Actually Do (And Why This Roadmap Works)
A data analyst takes messy, raw business data and turns it into decisions someone can act on — which product to discontinue, which city to expand delivery to, why churn spiked last month. It's less "math genius" and more "detective with a spreadsheet."
Here's why this career path is worth your next six months:
Low entry barrier, high ceiling: You don't need a CS degree or a 9 CGPA. Commerce, economics, and engineering grads all get hired.
Every company needs one: Fintech, e-commerce, healthcare, ed-tech — Razorpay, Swiggy, Zomato, and every bank in India runs on data teams.
Clear progression: Data Analyst → Senior Analyst → Analytics Manager → Data Scientist, if you want to go deeper.
Remote and hybrid friendly: Unlike many core-engineering roles, analytics work is easy to do from anywhere.
Skill-first hiring: Recruiters increasingly test what you can do in SQL and Excel over which college you're from.
Industry bodies like NASSCOM have consistently flagged data and analytics as one of the fastest-growing hiring categories in Indian tech — which is exactly why this roadmap focuses on the four skills that show up in almost every analyst job description.
Step 1: Master SQL Before Anything Else
SQL is not optional. It's the single most-tested skill in data analyst interviews, and most freshers get this order wrong — they start with Python or machine learning courses when the first filter every recruiter applies is basic to intermediate SQL.
What to Learn First
Core querying: SELECT, WHERE, GROUP BY, HAVING, ORDER BY
Joins: INNER, LEFT, RIGHT — you will be asked to explain the difference in almost every interview
Window functions: RANK(), ROW_NUMBER(), LAG/LEAD — this is what separates freshers who get shortlisted from those who don't
Subqueries and CTEs for breaking down complex business questions
Mistakes to Avoid
Watching tutorials without writing a single query yourself
Skipping window functions because they feel "advanced" — they show up in 70%+ of analyst SQL rounds
Practicing on toy datasets instead of messy, real-world ones
Pro Tip: Solve SQL problems on LeetCode tagged "Database" and on GeeksforGeeks — but time yourself. Interviewers care about how fast you write a correct query under pressure, not just whether you eventually get there.
Step 2: Get Fluent in Excel (Yes, Still)
Every fresher assumes Excel is "too basic" to matter. It's the opposite — a huge number of analyst roles at Indian companies (especially in banking, insurance, and retail) run entirely on Excel for the first 1-2 years.
What Recruiters Actually Test
Pivot tables and pivot charts
VLOOKUP, INDEX-MATCH, and XLOOKUP
Conditional formatting and data validation
Basic dashboarding with slicers
Where Most Candidates Fail
They can explain VLOOKUP in theory but freeze when given a live dataset
They've never cleaned a dataset with duplicates, blanks, and inconsistent formatting — which is 80% of real analyst work
Pro Tip: Don't just learn formulas — take a genuinely messy dataset (download one from Kaggle) and force yourself to clean it end-to-end before building a single chart. That's the actual job.
Step 3: Learn Python for Data Analysis
Once SQL and Excel are solid, add Python. You don't need to learn all of Python — just the data-handling stack.
Library | What It's For | Priority |
|---|---|---|
Pandas | Data cleaning, transformation, aggregation | Must-learn |
NumPy | Numerical operations, array handling | Must-learn |
Matplotlib / Seaborn | Data visualization in notebooks | Should-learn |
Scikit-learn | Basic predictive modeling | Optional (nice-to-have) |
Key Tip: If you're short on time, prioritize Pandas over everything else — it alone covers most of what a data analyst role actually requires day to day.
Step 4: Build Your Statistics Foundation
You don't need a statistics degree, but you do need to speak the language recruiters use — otherwise "which metric should we track" questions will trip you up badly.
Descriptive statistics: mean, median, mode, standard deviation, percentiles
Correlation vs. causation — this comes up constantly in interviews and on the job
Basic probability and distributions — enough to understand A/B test results
Hypothesis testing basics — p-values, confidence intervals, at a conceptual level
Pro Tip: Practice explaining "correlation isn't causation" using an Indian business example (like ice-cream sales and drowning deaths both rising in summer) — interviewers remember candidates who can teach a concept simply, not just recite it.
Step 5: Learn a BI / Visualization Tool
Raw numbers don't convince stakeholders — dashboards do. Pick one visualization tool and go deep rather than dabbling in three.
Tool | Best For |
|---|---|
Power BI | Roles at Indian product companies, MNCs, and most fresher job postings — free to learn, huge demand |
Tableau | Roles at MNCs and larger analytics teams; strong for portfolio pieces |
Google Data Studio (Looker Studio) | Free, quick to learn, good for marketing/growth analyst roles |
Key Tip: If you can only learn one, choose Power BI — it appears in more entry-level Indian job postings than any other BI tool right now, and Microsoft's free learning path gets you job-ready fast.
Step 6: Build a Portfolio That Gets You Shortlisted
Certificates don't get you interviews. Projects do. Recruiters skim resumes in under 10 seconds, and a GitHub link with real, messy-data projects stands out instantly against a wall of course completions.
Project Idea | Skills Demonstrated | Data Source |
|---|---|---|
Indian e-commerce sales dashboard | SQL, Power BI, Excel | Kaggle |
Zomato/Swiggy delivery-time analysis | Python, Pandas, visualization | Kaggle / public API |
Bank loan default prediction (basic) | Statistics, Python, SQL | Kaggle |
Startup funding trends in India | SQL, storytelling, dashboards | Public datasets |
Add 3-4 projects like these to your resume and portfolio, and write a short README explaining the business question, not just the code — that's what recruiters actually read.
Pro Tip: Every project should answer one clear business question in its title — "Which product category is losing the most revenue?" beats "Sales EDA Project" every time.
Step 7: Crack the Job Hunt (On-Campus and Off-Campus)
Placement season (December–February) isn't your only shot — most analyst hiring in India happens off-campus, year-round, through direct applications and referrals.
On-campus: Keep your resume analytics-focused even if your branch isn't CS — highlight SQL/Excel/Python projects prominently
Off-campus: Apply consistently on Naukri, Internshala, and Unstop; set aside 45 minutes daily rather than one big weekend push
Referrals: Reach out to alumni and mentors on LinkedIn — a warm referral skips the resume-shortlisting filter entirely
Community: Join analytics-focused community groups and events — hackathons are where a lot of fresher hiring quietly happens
Realistic salary range for freshers: ₹3.5–6 LPA at service-based companies (TCS, Infosys, Wipro, Cognizant), and ₹6–10 LPA at product companies and fintech firms (Razorpay, CRED, Groww, Meesho) for candidates with strong SQL, Python, and a solid portfolio.
A Realistic 4–6 Month Roadmap Timeline
Month | Focus |
|---|---|
Month 1 | SQL fundamentals + Excel basics |
Month 2 | Advanced SQL (joins, window functions) + Excel dashboards |
Month 3 | Python (Pandas, NumPy) + Statistics basics |
Month 4 | Power BI/Tableau + first 2 portfolio projects |
Month 5 | 2 more projects + resume, LinkedIn optimization |
Month 6 | Applications, mock interviews, referrals push |
Frequently Asked Questions About the Data Analyst Roadmap
Can I become a data analyst without a CS or engineering degree?
Yes. Commerce, economics, statistics, and even arts graduates regularly land analyst roles in India. Recruiters care far more about your SQL, Excel, and portfolio strength than your degree background.
Is Python necessary, or can I get hired with just SQL and Excel?
You can get shortlisted with strong SQL and Excel alone, especially at service-based companies. But adding basic Python (Pandas) significantly widens your options, particularly at product companies and fintech firms.
How long does it realistically take to become job-ready?
Most freshers following a structured data analyst roadmap for freshers in India become interview-ready in 4-6 months, assuming consistent daily practice — not passive video-watching.
Do I need a master's degree or an expensive bootcamp?
No. Free resources — NPTEL, GeeksforGeeks, YouTube, and official Power BI/Google learning paths — are enough to build every skill on this roadmap. Paid bootcamps can add structure but aren't mandatory.
What if I have a low CGPA — can I still get shortlisted?
Yes. A strong portfolio and solid SQL skills consistently outweigh a low CGPA in analytics hiring, especially for off-campus applications where recruiters filter on skills tests, not transcripts.
Should I target Data Analyst or Business Analyst roles first?
They overlap heavily for freshers. Apply to both — job titles vary a lot between Indian companies, and the actual skill requirements (SQL, Excel, dashboards) are nearly identical at entry level.
Conclusion: Stop Collecting Certificates, Start Building Proof
Here's the bottom line: a data analyst roadmap only works if you follow the order — SQL first, then Excel, then Python, then a BI tool, then projects that prove it.
Start with what you can control today:
Write your first 10 SQL queries this week — not next month
Pick one messy dataset and clean it fully in Excel
Set a 6-month calendar using the timeline above and stick to it
Build one portfolio project before you touch a second course
Apply off-campus from month one — don't wait for placement season
Reach out to one mentor or alumnus this week for a referral conversation
Every rejected application is data, not defeat. Every project you ship sharpens exactly the skills recruiters are screening for — so the fresher who follows this roadmap consistently for six months will always beat the one who collects certificates for a year.